|
"[I]n their eagerness for a bargain, in their zeal to explain too much too fast, scientists and philosophers often underestimate the complexities, trying to skip whole layers or levels of theory in their rush to fasten everything securely and neatly to the foundation (Daniel Dennett, 1995, 'Darwin's Dangerous Idea,' p. 82)."
0 Comments
After a lengthy internal replication that lasted two and a half years, we are finally ready to circulate the next installment of our ongoing empirical work: “Investment-based Costs of Equity.” Title: Investment-based Costs of Equity with Yicheng Liu (Ohio State) and Chen Xue (U. of Cincinnati) This paper develops the q5-characteristics model that estimates costs of equity as out-of-sample forecasts from cross-sectional regressions. The q5-cost of equity outperforms the accounting implied cost of equity in predicting cross-sectional returns. Our cost of equity is precise at the industry level and aligned with average factor premiums. Its firm-level distribution is weakly left-skewed, whereas the accounting implied cost of equity is right-skewed. However, the accounting cost of equity outperforms ours in the time series. Factor models perform poorly in all out-of-sample tests. Gradient-boosted trees improve on cross-sectional regressions in the q5-characteristics model, but not reliably. Compelled by the hard problem of asset pricing, I have been running a backpropagation through the neural network in my brain. And I have been ruthlessly updating the weights on nodes regardless of how deeply the nodes are embedded inside my web of beliefs. The backprop reached Walras (1874) in my last update in April 2024 (Vlog: Systems Finance). Since then, I have kept on pushing backward. Walras (1874) was not bothered by Clausius’s (1850) second law of thermodynamics or Darwin’s (1859) “Origin of Species.” And Boltzmann was just starting to publish articles that elaborate his probabilistic interpretation of the second law. Quantum mechanics and general relativity were both at least 30 years in the future. All these scientific developments put tremendous pressure on mechanical philosophy. Alas, Walras hardly felt any such pressure and enthusiastically embraced his fellow Frenchmen, Rene Descartes and Pierre Gassendi. Descartes and Gassendi revolted against Thomistic scholasticism, which descended from Aristotle’s hylomorphism. An acorn grows into an oak tree because the former has the potentiality (matter) to become the latter actuality (form). Mechanical philosophers wanted nothing to do with formal and final causes, which represent occult powers to them, and retained only efficient causes. Consequently, change is very limited in mechanical philosophy. Change is only locomotion of tiny, indivisible, and eternal atoms. For Newton, what’s the difference between his apple and Jupiter? Nothing. Jupiter is just a gigantic apple. You can aggregate mass easily. Walras has bequeathed to us all the limitations of mechanical philosophy. What’s the difference between an individual and society? Nothing. Society is just a gigantic individual. Everyone knows nonlinear utilities do not aggregate. Alas, we are stuck because of no viable alternative. Macro Finance is defined by its all-important questions, not by the representative agent. I am revolting against the representative agent, not Macro Finance. Formulating a viable alternative is challenging. In epistemology, all core beliefs cohere (interlock). Once I start to replace aggregation with emergence, which is the antithesis of aggregation in philosophy, rational expectations must go. Emergence means novelty, new causal powers, radical uncertainty, and perpetually incomplete markets. In Savage’s large world, only ecological rationality is feasible. God has not endowed us with his God’s eye-view of the world. And emergence occurs in time. Time has an arrow. The world is a process, not an equilibrium. In the 2,500-year debate on being vs. becoming, Walras has taken the most radical position on being that would make Parmenides proud. A static theory of equilibrium has been overthrown in physics by the big bang theory since the 1960s. Darwin overturned it even earlier in biology. While our genes have not changed much in the past one million years, think how much of our lives have changed since ChatGPT showed up just a few years ago. The equilibrium theory of economics is deeply wrong. Time for us files to fly out the fly-bottle. I elaborate on these developing ideas in my recent Keynote presentation titled "Corporate asset pricing: A process theory of finance" at Fidelity's Distinguished Speaker Series on September 26, 2025. Please see slides and video recording below. I am very grateful to Dr. Roy Zhang for the kind invitation. We have just released the 2025 edition of testing portfolios for the q-data library based on "Replicating Anomalies" [Podcast]. Please see:
https://global-q.org/testingportfolios.html In 2024, the profitability and momentum portfolios have performed well. Across the 50 anomaly variables, the high-minus-low profitability decile earns on average 26.88%. And across the 42 variables, the high-minus-low momentum decile earns on average 16.72%. Alas, the value and investment portfolios have performed poorly. The value portfolios earn on average -26.88%, and the investment portfolios -9.24%. I have put together (and uploaded to YouTube) a list of AI-podcasts based on my research articles:
These podcasts are generated automatically by AI (NotebookLM). I have no control over the contents. I have listened to them all. The contents seem fine (a bit too generous) to me. The podcasts might help in case you have trouble sleeping.  "Find a scientific [wo]man who proposes to get along without any metaphysics... and you have found one whose doctrines are thoroughly vitiated by the crude and uncriticized metaphysics with which they are packed." (Charles Sanders Peirce, 1839-1914)  Source: Updated q-factors through December 2024 (global-q.org/factors.html). Please also check out the last blog post titled "1,000" (https://theinvestmentcapm.com/blog/1000). Sorry, I couldn't resist. Maturity has to wait. Extremely grateful to Prof. Geert Bekaert (Editor) and a senior referee for letting the q-factor paper see the daylight.  Compelled by the hard problem of asset pricing, I have abandoned equilibrium theory with rational expectations in search for a more promising land. I might have found it in systems theory with bounded rationality. The hard problem is as follows: If demand and supply just intersect at equilibrium, why, then, does the consumption CAPM fail, but the investment CAPM succeed in the data? In retrospect, I was trying to have the cake and eat it too. I was treating efficient markets as virtually identical as equilibrium theory with rational expectations. However, while interpreting the investment CAPM literature as defending efficient markets, I have ignored the broad failure of the consumption CAPM in the cross section. A big thank-you to my interlocutor. In a parallel universe, without being called out as "a bit misleading" with the investment CAPM, I would still be in my dogmatic slumber. In this universe, alerted by the hard problem, I have been foraging far and wide from my home habitat of equilibrium theory. And diverse hints are pointing me toward systems theory. The standard theory (equilibrium) is built on the following ontological presuppositions:
The systems theory rides on a different set of ontological presuppositions:
In my presentation at EDHEC Speaker Series, I explain why after 20 years of defending equilibrium theory, I have no choice left but to leave it behind in pursuit of systems theory. To solve the hard problem of asset pricing is my urge. And the socialist calculation debate is my phase transition. Please see slides and video recording below. I am very grateful to Prof. Hamid Boustanifar for the kind invitation. We have just released the 2024 edition of testing portfolios for the q-data library. Please see:
global-q.org/testingportfolios.html All anomaly categories except for profitability have taken a hit in 2023. Across 48 anomaly variables, the high-minus-low profitability decile earns on average 18.57%. The expected growth decile has done even better, earning on average 35.84%, 40.73%, and 32.69% at the 1-, 6-, 12-month horizons, respectively. I have changed my blog name from "Corporate Asset Pricing" to "Finance Colada" in honor of the three bloggers at Data Colada.
 What must the world be like for asset pricing anomalies to be possible?
Specifically, in the Arrow-Debreu equilibrium theory, the consumption CAPM and the investment CAPM should deliver identical expected returns. Why then does the consumption CAPM fail, but the investment CAPM succeed in the data? I call this problem the hard problem of asset pricing, inspired by David Chalmers’s (1996) hard problem of consciousness. I have been obsessed with this problem since February 2021 after being told the investment CAPM is “a bit misleading.” Clearly, my prior arguments have all failed. Surveying the wreckage, I zero in on the only one thing I have not done. In Lakatosian terms, enough protective belt, time for me to smash the core of equilibrium theory. After studying about 350 books on history and philosophy of science and related fields, I deduce that the world is not a machine in equilibrium. Rather, the world is a system of open, adaptive systems in evolution. The investment CAPM literature fits much better with systems theory (with bounded rationality) than with equilibrium theory (with rational expectations). My Wittgensteinian turn. This maturity thing is so hard. The consumption CAPM does not exist in the reality of micro finance. Just like temperature does not exist in molecules in statistical mechanics. This systems worldview has entered my writing for the first time, please see “Firm-level Irreversibility” (Section 4, only 3 pages) newly circulated on SSRN: https://papers.ssrn.com/sol3/papers.cfm?abstract_id=4653045 We have just released the 2023 update of testing portfolios at the q-data library. Please see:
global-q.org/testingportfolios.html We are happy to report that our "Replicating Anomalies" article has recently surpassed 1,000 cites on Google Scholar: https://scholar.google.com/citations?view_op=view_citation&hl=en&user=jjX1n8kAAAAJ&citation_for_view=jjX1n8kAAAAJ:8eKeg6BV7vYC Among the newly released data, one statistic jumps out. Averaging across the 32 anomalies in the value-versus-growth category, the high-minus-low decile earns an average return of 32.14% in 2022. In my June-2021 vlog: "The Value Premium," at the time when many were wondering whether the value premium has disappeared, I wrote that the value premium should recover. The conjecture was based on the causal asymmetry mechanism worked out in my thesis. I wrote on my blog: "To invoke Karl Popper, this prediction is highly falsifiable. Time will tell." Time has just told, it seems. Such causal structure is what we are going after via theorizing (scientific modeling). No number of of 3-, 5-, and 6-factor regressions can get you anywhere close. I might have finally awakened from my dogmatic slumber. I have started to question equilibrium theory, systematically. And I know exactly where to hit. A Wittgensteinian turn. A mid-life crisis (of sorts). My immediate task is the consumption vs. investment CAPM debate. I have come to realize that the debate is less about demand vs. supply of assets but more about macro vs. micro finance. Despite my effort (2019 JFE), I see no way to bridge the micro-macro gap within the Arrow-Debreu world. The world is not flat. The empirics-theory gap in asset pricing is in fact the micro-macro gap. Walras (1874) was following Newton's clockwork universe. However, modern physics features both general relativity (macroscopic) and quantum mechanics (microscopic), as well as many layers in between (e.g., solid-state physics). No one has ever claimed, macro-reductively, that physics is all about general relativity. (Like asset pricing is all about the SDF.) Einstein never dismissed quantum mechanics as not physics. He just wanted a better link with general relativity.  (Spacetime might be emergent from the quantum wave function, but how? Source: Facebook) Analogously, asset pricing cannot possibly be nothing but the SDF. Alas, this SDF nothing-buttery is the organizing principle for all our asset pricing textbooks (MBA and PhD) and most of the scientific literature (especially asset pricing theory). The SDF nothing-buttery is what Daniel Dennett (1995, "Darwin's Dangerous Idea") would call "greedy reductionism." When "in their eagerness for a bargain, in their zeal to explain too much too fast, scientists and philosophers often underestimate the complexities, trying to skip whole layers or levels of theory in their rush to fasten everything securely and neatly to the foundation (p. 82)." Dennett was defending biology as a separate field from physics. No one has ever felt the need to defend physics (micro) from biology (macro). Philip Anderson (1972, "More Is Different") was defending solid-state physics from particle physics: "At each stage, entirely new laws, concepts and generalizations are necessary, requiring inspiration and creativity to just as great a degree as in the previous one." Anderson was defending macro (meso at least) from micro, not the other way around. Alas, defending micro against macro is the peculiar position where I find myself in asset pricing. Against the consumption orthodoxy in macro finance, I am reiterating, for the Nth time, in which N is large enough for statistical mechanics to work, that the investment CAPM is a separate, emergent asset pricing theory in micro finance. This time I have philosophy of science on my side. The investment CAPM clearly works in the data. The q-factor model has just appeared in Bodie, Kane, and Marcus's (2024) Investments (13e). It seems that the 6-factor model, with epicycles on top of epicycles, is running mostly on personal loyalty, which should have played no role relative to scientific merits. As a scientific realist, I infer from the anomalies evidence to its best explanation that the investment CAPM corresponds to how the (micro) world works, but the consumption CAPM does not. Again, think quantum vs. classical mechanics. It would be a miracle for the q-factor model to succeed in the anomalies literature if the investment CAPM does not describe our micro reality (Putnam's [1975] no-miracles argument). Corporations, not investors, are the primary causal powers of their own asset prices. God help me.  (Me vs. SDFists. Source: Facebook) (Never could have imagined the 3-factor model was just a warmup.) The big question looms large: Is there a theory of everything (like in physics) that can unify micro and macro finance? I am working on it. Feel free to join me. It's not a one-person job. It will likely take decades, if not a century. Just look at theoretical physics. And if it exists, it's not equilibrium theory. The representative agent is not an agent. The marginal investor is not an investor. (Much like an ant colony is not an ant.) They are meaningful (like Santa Claus, unicorn, pegasus) in our story telling. But without microfoundation, they do not exist in our social ontology (Little 2016). No microfoundation, no explanation. So even if you find an SDF that fits the data in micro finance, I can still contest your explanatory power. Whatever the unified theory down the road, the investment CAPM will survive, because a corporation is an actor (agent). Once asset pricers learn to build macro models from bottom up, hopefully by 2123, with heterogeneity among diverse actors playing an essential role, the consumption CAPM will be remembered, nostalgically, like the 3-factor model. Please see below for a progress report (as of last October) at the 2022 FMA Annual Meetings (slides). The presentation title is inspired by W. V. O. Quine's (1951) "Two dogmas of empiricism." Note: At 55:15, I said "When you write down a FORTRAN program, you already assume the world is like Newtonian mechanics." I'd like to take it back. Lucas might well be right about computational social science, but the program is unlikely about equilibrium or in FORTRAN.
I am happy to report that the Hou-Xue-Zhang q-factor paper (2015 RFS) has been discussed in the latest Bodie, Kane, and Marcus (2024) Investments (13th edition, p. 364, p. 426).   The q-factor paper joins Petkova and Zhang (2005) and Zhang (2005), both of which have been featured in Bodie et al.'s Investments textbook since 2006 (7e).
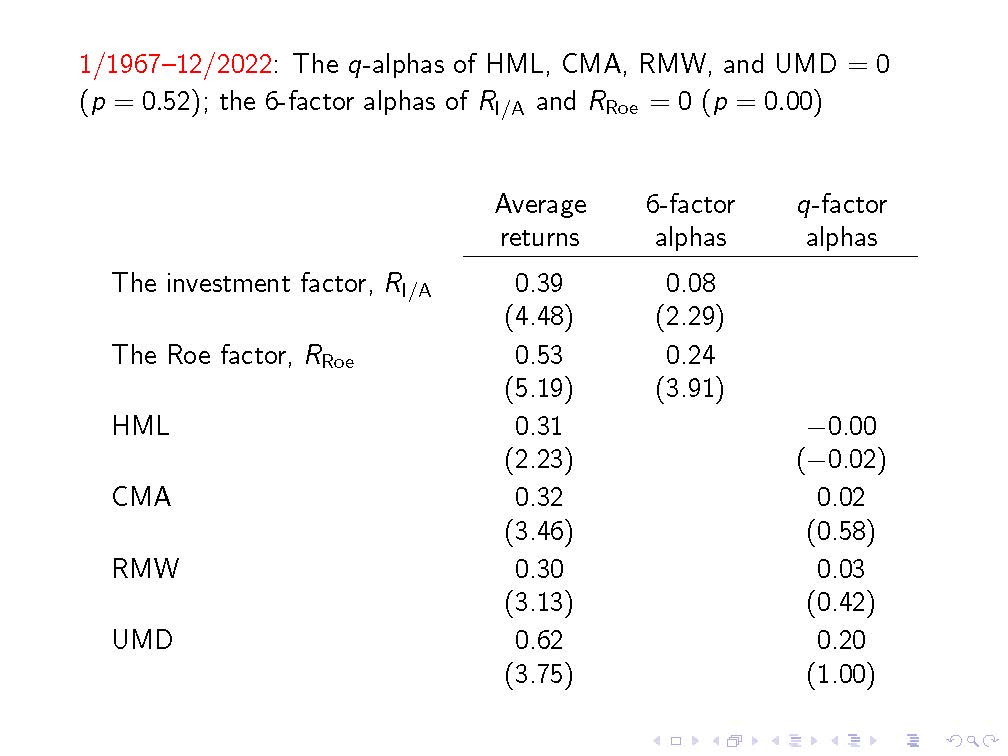 Please see below for recursive factor spanning tests all the way back to December 2014:   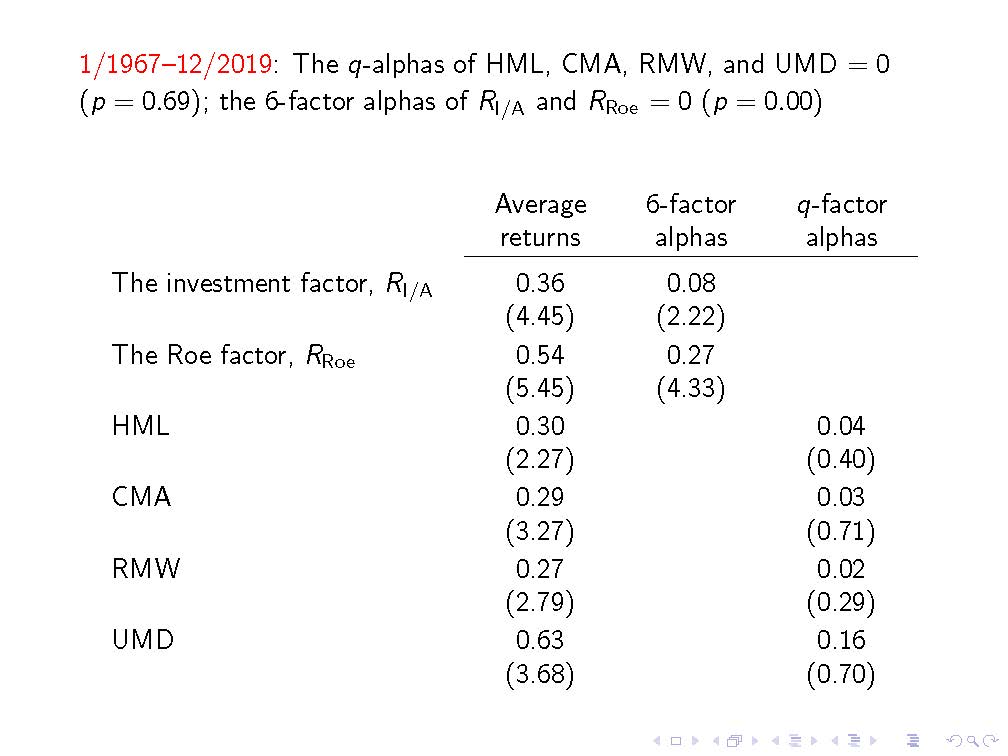      I am incredibly honored and humbled to deliver my keynote on "Realist Asset Pricing: A Copernican Revolution" in the 2022 Brazilian Finance Meeting on July 28, 2022. I am extremely grateful to Prof. Ricardo D. Brito, the President of Brazilian Finance Society, for the kind invitation. The talk gives a progress report on my ongoing effort to rebuild the philosophical (meta-theoretical) foundation for asset pricing. While I will spell out the details in due time, the big picture has mostly established in my mind. A heads-up: Quite a few major revisions in my web of beliefs are in the making... Please see the slides and the presentation video below... Our article "The Economics of Security Analysis" (Hou, Mo, Xue, and Zhang 2022) has been accepted at Management Science. An intriguing finding is that top-20 (about 1%) active, equity funds outperform by holding high expected growth, low investment stocks at the expense of other funds who hold the opposite sides of the trades in equilibrium. In particular, top-20 active fund portfolios have significantly positive expected growth and positive (albeit insignificant) investment factor loadings, whereas aggregate active fund portfolios have significantly negative loadings on both factors. Please see the latest draft, the internet appendix, slides, as well as video presentation below: We have just completed a massive empirical paper "Asymmetric investment rates" (Bai, Li, Xue, and Zhang 2022), with 128 pages short. The main data work is to construct firm-specific current-cost capital stocks (the replacement costs) for the entire Compustat sample. The headline result is that the firm-level current-cost investment rate distribution is heavily right-skewed, with a small fraction of negative investment rates, 5.51%, but a huge fraction of positive investment rates, 91.64%. The histogram below (Figure 4 in our paper) shows that the firm-level asymmetry is comparable with, if not more impressive than, the Cooper-Haltiwanger (2006) plant-level evidence (their Figure 1). 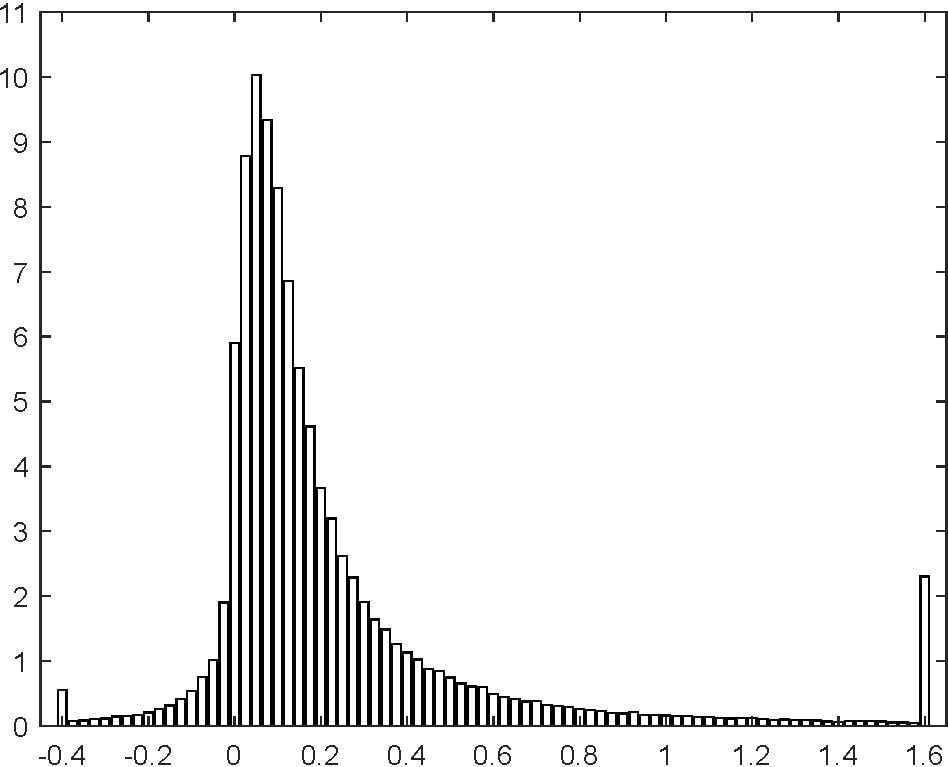 I've also put some slides together for my upcoming keynote at the 2022 Financial Markets and Corporate Governance Conference (FMCG) organized by Monash Business School. We have just updated our q-factors and expected growth factor through December 2021. The data are available at the Factors page of global-q.org. We expect to get our testing portfolios updated within four weeks. 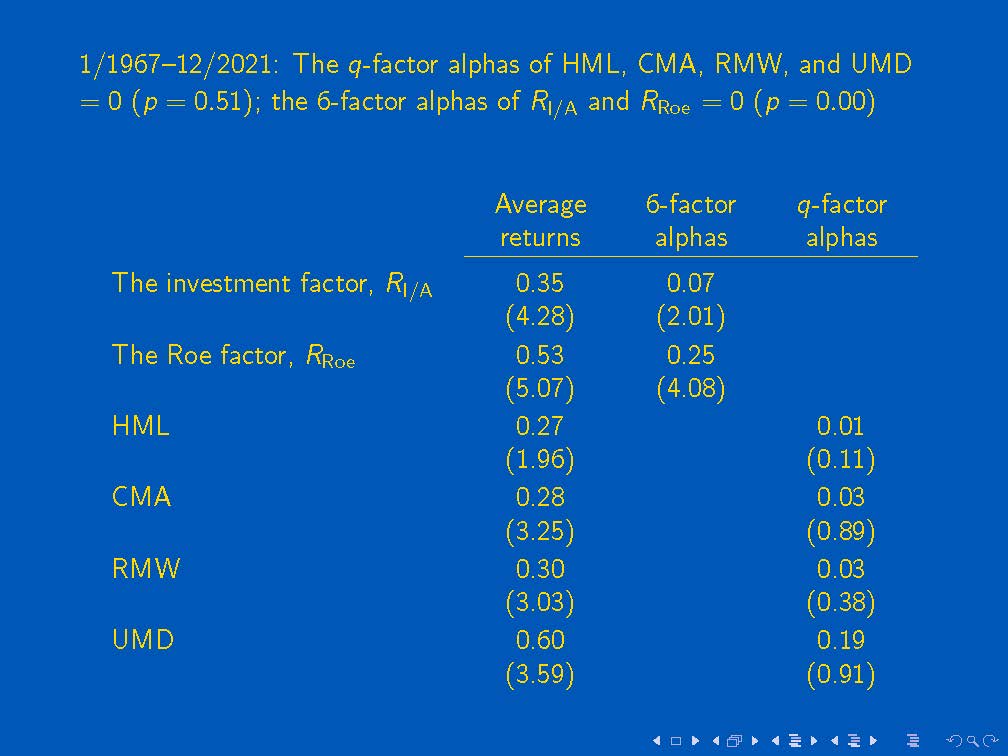 The article on "Searching for the Equity Premium" (Bai and Zhang 2022) has just been published in the February 2022 issue of Journal of Financial Economics. Our key insight is that a DSGE model with recursive utility, search frictions, and capital accumulation is a good start to forming a unified theory of asset prices and business cycles. Please see the article, slides, and presentation: This work is the latest development in our research program that aims to integrate macro labor with asset pricing in order to explain the equity premium puzzle in general equilibrium production economies. Prior contributions in this research program include "Endogenous Disasters" (Petrosky-Nadeau, Zhang, and Kuehn 2018) at American Economic Review. Please see the article, slides, codes, and presentation: Another contribution in this research program is "Solving the Diamond-Mortensen-Pissarides Model Accurately" (Petrosky-Nadeau and Zhang 2017) at Quantitative Economics. Please see the article, slides, codes, and presentation: Asset pricing is in a Kuhnian crisis. And it has been since 1992. The asset pricing theory that one would read in doctoral textbooks is the consumption CAPM, and the theory in MBA textbooks is the class CAPM. Alas, we know the CAPM fails in the data, and the consumption CAPM performs often worse than the CAPM. Where do we go from here? A prominent answer in the prior literature is the joint-hypothesis problem. There could be nonmarket risk factors absent in the CAPM. However, what counts as a risk factor is controversial. The joint-hypothesis problem is a specific example of the Duhem-Quine thesis in philosophy of science. The thesis says that when we test a specific hypothesis, we are in effect testing a whole web of beliefs underlying its development. In the context of the CAPM, a long list of assumptions, including metaphysical presuppositions, has been made in its derivation. Where exactly do we pin the blame for the model’s failure? I blame the metaphysical presupposition of the consumption CAPM that the marginal investor is the marginal agent who determines asset prices. More specifically, I blame the assumption of homogeneous expectations (beliefs) for investors in the CAPM and the existence of a representative investor in the consumption CAPM. Ontology is a branch of philosophy that studies the fundamental structure of reality. Consider the following two possible worlds. Which world do you think is closer to the mind-independent reality we are living in? Possible World 1: At the end of each September (fiscal yearend) of calendar year t, all shareholders of Apple Inc. elect a marginal investor, who represents the best interests of all shareholders. The marginal investor then marches into Tim Cook’s office in Cupertino and dictates to Tim the cost of equity for Apple Inc. in the next fiscal year. After receiving the cost of equity, Tim and his management team then work out Apple’s operating, investing, and financing decisions for the next fiscal year. Possible World 2: Tim Cook and his management team do whatever they want to maximize the shareholder value to the best of their abilities. While paying attention to external capital markets, they already have a sense of what their cost of equity is likely to be. Some shareholders will approve what the management is doing and buy and hold Apple shares. Others who disagree can feel free to leave by selling their shares. Unless facing a major decline of Apple’s share price, Cook and his team continue to do whatever they feel is the right thing to do. If you find Possible World 1 absurd, keep in mind that is exactly the ontology presupposed in the academic finance literature, often without us consciously aware that we are doing so. Thus when teaching capital budgeting in corporate finance and equity valuation in accounting, we take the cost of equity as a free parameter. We then tell students to take a course on investments to pin down the parameter with a factor model. (Though curiously, most empirically efficacious factor models are built on firm characteristics, not investor preferences. Although the 3-factor model is dead, the CAPM is deader.) Thus in the theoretical asset pricing literature, we have the metaphysical presupposition “Asset pricing is all about the pricing kernel” declared as incontrovertible truth. This decree ensures an ill-founded hegemony of the consumption CAPM over the investment CAPM. Thus in the empirical asset pricing literature, the joint-hypothesis problem only covers missing risk factors, while leaving the question why we should waste more time on the pricing kernel (risk factors) to begin with unanswered. Possible World 2 is the ontological foundation of the investment CAPM, which it shares with corporate finance and accounting. Alas, for the most part, the latter two fields have largely ignored their own impact on cross-sectionally varying expected returns (asset prices). Possible World 2 is much closer to our reality. While still germinating in my brain, I am gradually arriving at the philosophical position that the corporate manager, not the marginal investor, is the marginal agent (causal power) that determines the asset price of the manager’s own equity. It is conceivable that a venture capitalist can bully his way with the manager of a private equity or a microcap public equity. (I say “his” because most bullies I have encountered in life are male.) But I doubt Tim Cook can be bullied by anyone. All in all, the fundamental structure I have in mind is a powerful manager on one side and a diffuse assemblage of shareholders, who are best at bickering among themselves, on the other. Which side do you think is more causally powerful for the asset price of the manager’s own stock? If my carving of the fundamental structure of finance is more accurate than that of prior authors, then it might be time to substantially revise what we call standard asset pricing theory (i.e., the consumption CAPM) in our textbooks. In my recent interview with Jack Forehand and Justin Carbonneau, I discuss the related scientific debate within asset pricing. The clash between the 3-factor model and the q-factor model is a clash between two philosophies of science and two visions for the future of asset pricing. And an epic struggle for its soul. The 3-factor model is a product of empiricism. This philosophy of science dates back to David Hume in the 18th century, arises as logical positivism of the Vienna Circle in the 1930s, and modifies as logical empiricism in the 1950s and 1960s. Empiricism is built on the verification principle, which insists that all scientifically meaningful statements must be verifiable (testable) with our senses, facts, and data. The verification principle emphatically rejects metaphysics, including theories of causation beyond Hume’s constant conjunctions (correlations). After reaching its heyday in the 1960s, philosophers today generally regard empiricism as defunct. Most tellingly, the verification principle itself is not verifiable, meaning that it is itself an unfalsifiable metaphysical presupposition. Oops. As far as philosophy goes, this defect is insurmountable... All in all, theory is indispensable. In asset pricing, empiricism has also crashed to the ground, albeit only recently. The 6-factor paper states (2018, p. 237): “We include momentum factors (somewhat reluctantly) now to satisfy insistent popular demand. We worry, however, that opening the game to factors that seem empirically robust but lack theoretical motivation has a destructive downside: the end of discipline that produces parsimonious models and the beginning of a dark age of data dredging that produces a long list of factors with little hope of sifting through them in a statistically reliable way (my emphasis).” Seriously? The beginning of a dark age? Isn’t it really the end of the dark age ushered in by the 3-factor paper in 1993? The q-factor model published in 2015 has ended the dark age. And the 6-factor paper merely confirms the end of the dark age via a form of doublespeak, it seems. The creation of the q-factor model is an imaginative, abductive, and iterative fusion between asset pricing theory and asset pricing empirics. The q-factor model asks: What the fundamental structure of capital markets must be like for us to observe asset pricing anomalies? The starting point is theoretical (transcendental). After I identify the causal powers of investment and profitability in 2005, it then takes another 10 years to put the empirics together. Contrary to Hume’s induction, the scientific inference is retroduction (closely related to abduction, i.e., inference to the best explanation). Far from Hume’s empiricism, the philosophy of science embodied in the q-factor model is Roy Bhaskar’s critical realism. In addition to the domain of the empirical (observed events, the only reality accepted in empiricism), critical realism also allows the domain of the real (causal powers, causal structures, and causal mechanisms). All in all, theory plays an important, if not major, role in science. About time to take causation seriously in asset pricing. Please see my latest interview below with Jack Forehand and Justin Carbonneau on my recent adventure into philosophy of science in the context of scientific debates within asset pricing. |
Lu Zhang
An aspiring process metaphysician Archives
April 2026
Categories |
 RSS Feed