|
The q-factors library at global-q.org has just been updated through December 2019. The table below reports the latest head-to-head factor spanning tests: The Hou-Xue-Zhang (2015) q-factor model continues to dominate the Fama-French (2018) 6-factor model in the January 1967--December 2019 sample. 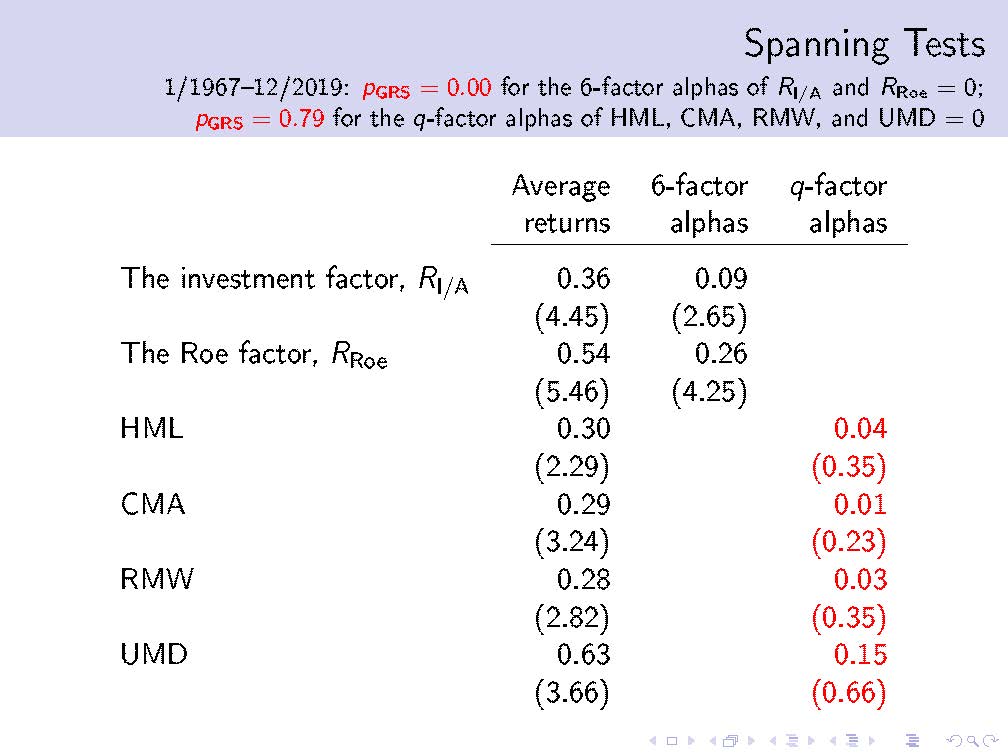 On the one hand, the 6-factor model cannot subsume the q-factors. The investment premium is 0.36% per month (t = 4.45), with a 6-factor alpha of 0.09% (t = 2.65). The return on equity (Roe) premium is 0.54% (t = 5.46), with a 6-factor alpha of 0.26% (t = 4.25). The Gibbons-Ross-Shanken (1989, GRS) test strongly rejects the 6-factor model based on the null hypothesis that the 6-factor alphas of the investment and Roe premiums are jointly zero (p = 0.00). On the other hand, the q-factor model fully subsumes the Fama-French factors. The HML, CMA, and RMW premiums are on average 0.3%, 0.29%, and 0.28% per month (t = 2.29, 3.24, and 2.82), but their q-factor alphas are tiny, 0.04%, 0.01%, and 0.03% (t = 0.35, 0.23, and 0.35), respectively. The momentum factor, UMD, is on average 0.63% (t = 3.66), but its q-factor alpha is small, only 0.15% (t = 0.66). The GRS test fails to reject the q-factor model based on the null that the q-factor alphas of HML, CMA, RMW, and UMD are jointly zero (p = 0.79). Don't take my word for it. Go ahead and replicate the numbers. If your replication fails, I am the jerk. Otherwise, how about using the better factor model from now on? That's right. Ten years on, it seems that the q-factor model is indeed "A Better Factor Model That Explains More Anomalies." My apologies for taking so long, but please know that we're doing the best we can.
1 Comment
3/18/2020 06:04:31 am
Thank you very much for making your data available. The performance of the "q" model is impressive from an investment perspective. Based on the pairwise non-nested model comparison tests proposed by Barillas, Kan, Robotti, and Shanken (2020), it can be easily verified that the "q" model outperforms the Fama and French (2018) 6-factor model over the 1967-2019 sample period. The difference in bias-adjusted sample squared Sharpe ratios between the two models is 0.041 and the asymptotic p-value of the test is 0.044. The outperformance of the "q" factor model is even more impressive when the competitor is FF5, the five-factor model proposed by Fama and French (2015). In this case, the difference in bias-adjusted sample squared Sharpe ratios between the two models is 0.068 and the asymptotic p-value of the test is 0.005. Your comment will be posted after it is approved.
Leave a Reply. |
Lu Zhang
An aspiring process metaphysician Archives
September 2025
Categories |
 RSS Feed